Create Professional Gantt Charts in Minutes, Not Hours
Import from Excel, generate in PowerPoint. Works on Windows & Mac.
Why Choose Gantty?
Save Hours of Work
From Excel to PowerPoint in 2 minutes
Works Everywhere
Windows & Mac. One solution.
Collaborate Seamlessly
Share datasets, work together
Native PowerPoint Shapes
Real PowerPoint shapes, not embedded web views
Affordable Monthly Pricing
Low monthly fee, no yearly commitment
AI-Powered Summaries
Automatic executive summary generation
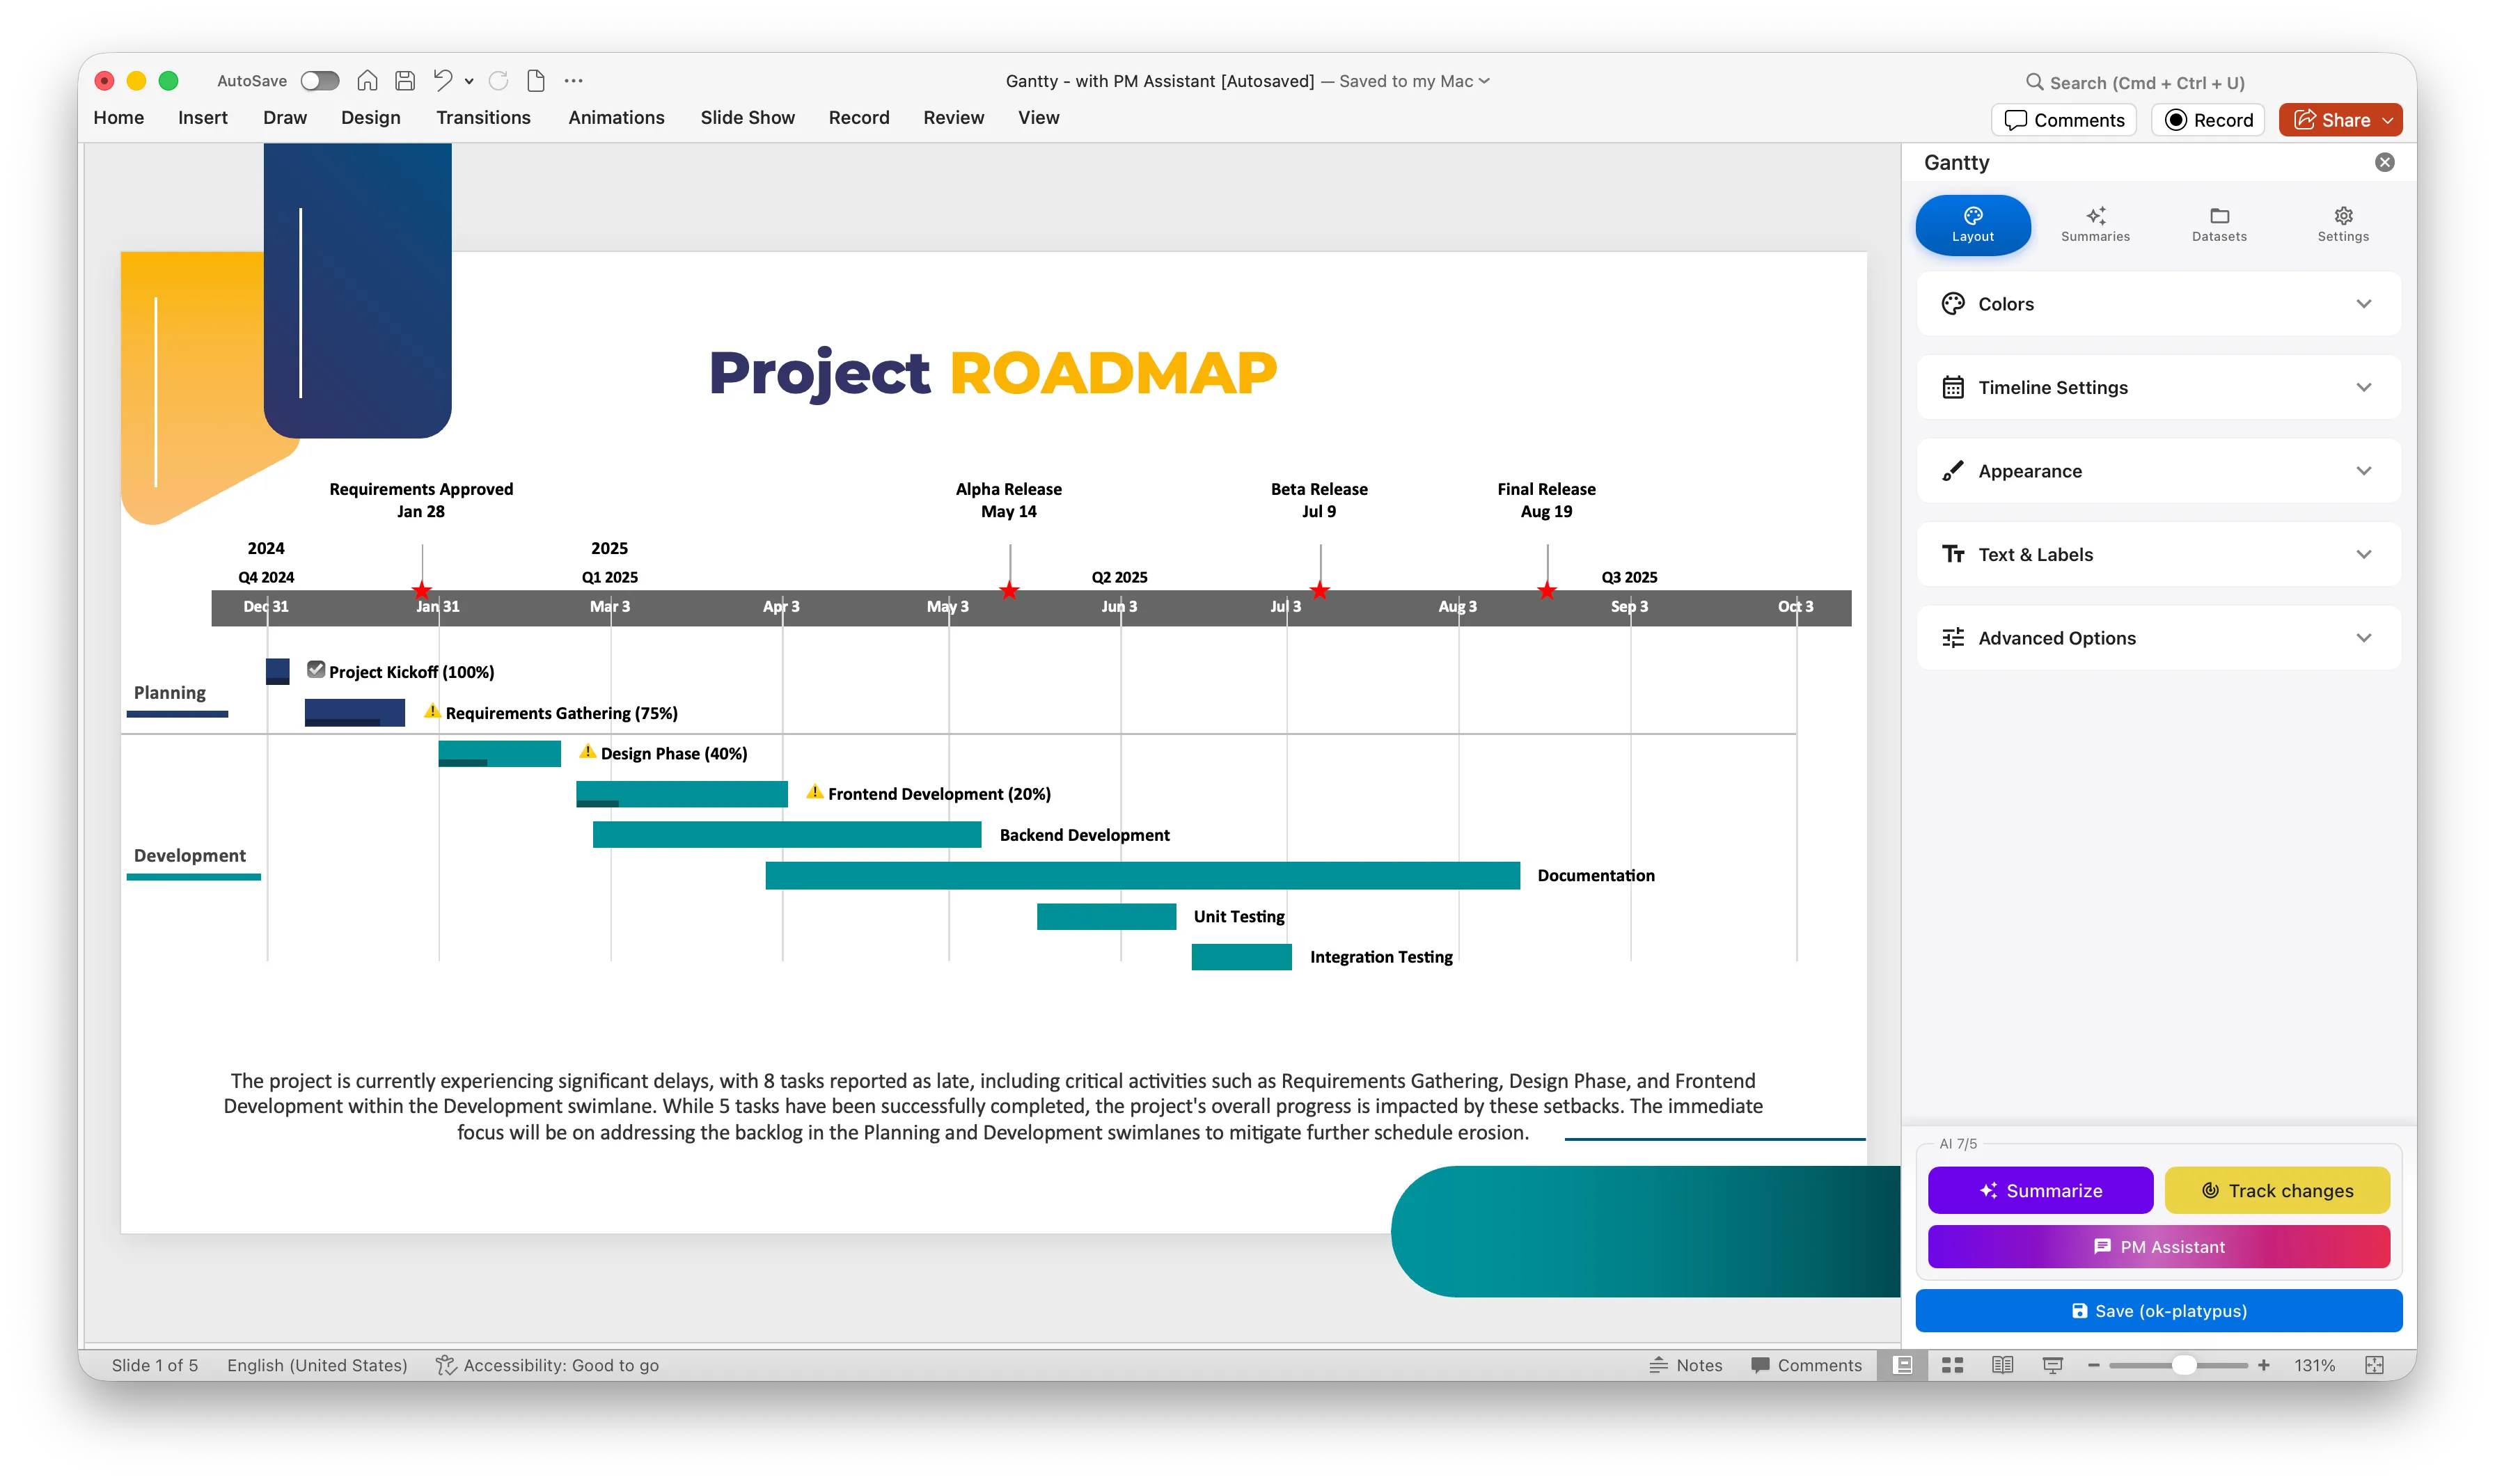
See Gantty in Action
Watch how easy it is to create professional Gantt charts from your Excel data
Pick your power
Transparent Scaling for Modern Teams
Foundation
Free
$0
EUR
- Excel Import
- Native PowerPoint Integration
- Cross-platform Support
- Professional Quality Charts
- 10+ Languages Supported
- Tasks per chart: Up to 7
- Import Public Holidays
- Community Support
Most Popular
Professional
Pro
$20
EUR/mo
- Unlimited
- Team Management
- Dataset Sharing
- Multi-user Collaboration
- Cloud Dataset Saving
- Automatic Executive Summary Generation
- AI-based Project Management Assistant
- Advanced Color & Style Options
- Priority Support
Frequently asked questions
Create Professional Gantt Charts in Minutes, Not Hours
Import from Excel, generate in PowerPoint. Works on Windows & Mac.